本記事はStreamlit入門の9回目です。ここまで学習したことをベースに実際にいくつかアプリを作ってみましょう。いくつか見ているうちにパターンがみえてくると思います。
本記事はFuture Coders独自教材からの抜粋です。
Streamlit入門 – 9)サンプルアプリ 目次
IRIS
seabornのデータセットIrisを使ったサンプルです。
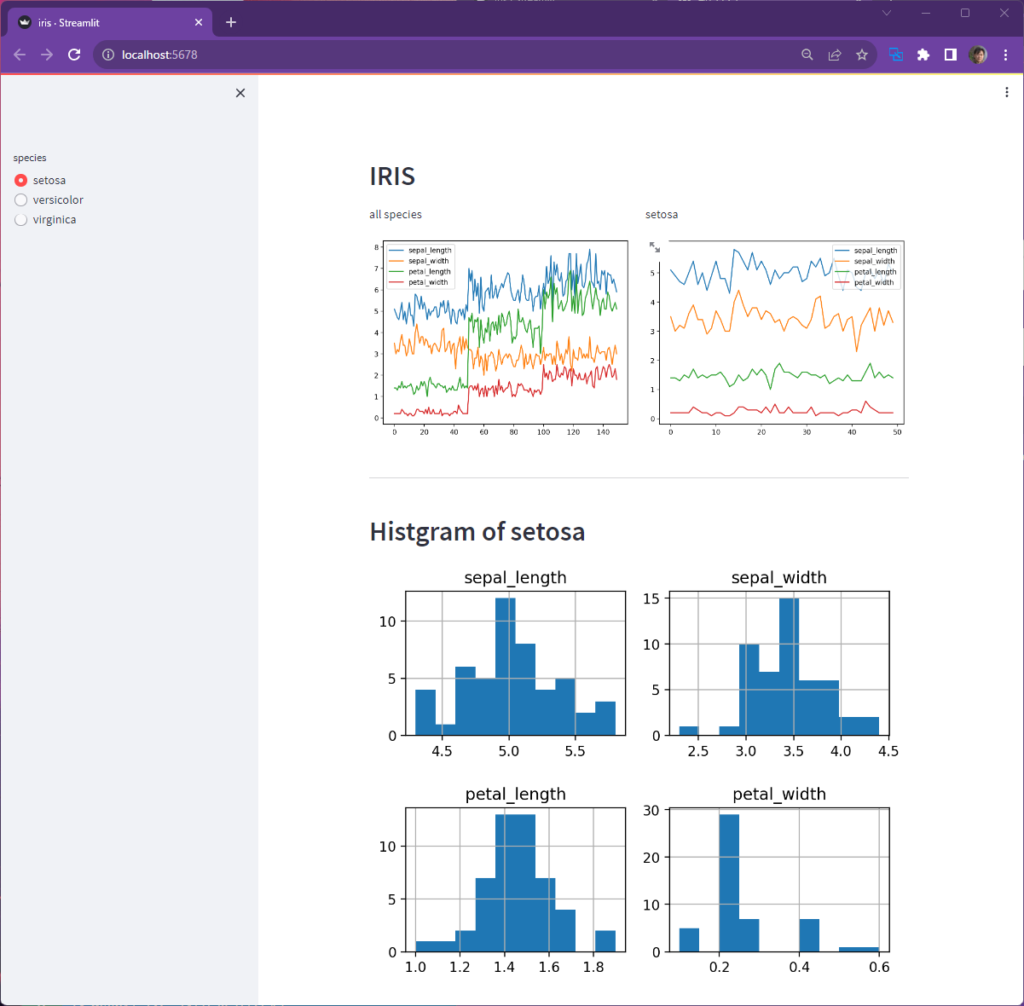
サイドバーから種類を選ぶと、その種類のグラフが描画されます。
import streamlit as st
import seaborn as sns
import matplotlib.pyplot as plt

df = sns.load_dataset("iris")
selected = st.sidebar.radio("species", ['setosa', 'versicolor', 'virginica'])
st.header("IRIS")

col1, col2 = st.columns(2)
with col1:
    st.write("all species")
    st.pyplot(df.plot().figure)

with col2:
    st.write(selected)
    st.pyplot(df[df["species"]==selected].plot().figure)

st.divider()

st.header(f"Histgram of {selected}")

fig, ax = plt.subplots(2,2)
plt.subplots_adjust(hspace=0.5)

select_df = df[df["species"]==selected]
select_df["sepal_length"].hist(ax=ax[0,0])
select_df["sepal_width"].hist(ax=ax[0,1])
select_df["petal_length"].hist(ax=ax[1,0])
select_df["petal_width"].hist(ax=ax[1,1])
ax[0,0].set_title("sepal_length")
ax[0,1].set_title("sepal_width")
ax[1,0].set_title("petal_length")
ax[1,1].set_title("petal_width")

st.pyplot(fig)
解説
ページレイアウト
st.sidebarを使って、サイドバーにラジオボタンを表示しています。サイドバーの使い方は以下の記事を参照してください。
Streamlit入門 – 5)レイアウト – Future Coders (future-coders.net)
上記の例では、3つの種類を直接記述していますが、以下のように列から一意の値を取得するuniqueメソッドを使っても同じ結果が得られます。種類が多いときやスペルが長いときは便利に利用できます。
selected = st.sidebar.radio("species", df["species"].unique())画面本体はst.columns関数で2列のレイアウトにしています。with構文を使うとよいでしょう。変数selectedには’setosa’, ‘versicolor’, ‘virginica’のどれかの文字列が代入されます。
col1, col2 = st.columns(2)
with col1:
    1列目の記述

with col2:
    2列目の記述
グラフの描画
データフレームのplotメソッドで折れ線グラフが描画されます。df.plot()の戻り値はAxesSubplot型です。そのプロパティfigureをst.pyplotに渡すことでStreamlitでグラフを描画できます。以下のように記述してもおなじ結果となります。
ax = df.plot()
st.pyplot(ax.figure)
右側のカラムでは選択された種類に一致する行を抽出したあとで同じようにplotで描画しています。
以下のコードが選択された種類に一致する行を取り出すコードです。
df[df["species"]==selected]df[列] で列のSeriesを取り出し、文字列selectedと比較することで、True/FalseのSeriesが作成されます。その結果(df[“species”]==selected)を抽出条件として、df[抽出条件]のように行を取り出していることに注目してください。DataFrameで条件に応じた行を選択するときに使われる手法です。
画面下部では2つの方法でヒストグラムを描画しています。
df.histを使った方法
今回データフレームには4つの数値列があります。よって、df.hist()と実行すると、以下のようにAxesSubplotの2次元配列が戻り値として返ってきます。
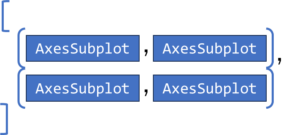
pandasのデータフレームでグラフを描画した場合、その内部ではmatplotlibが使用されます。matplotlibは個々のグラフをAxesSubplotで、グラフ全体をfigというように管理しています。
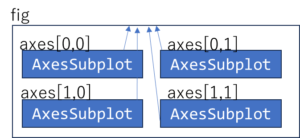
よって、以下のようにhist()の戻り値から、個々のAxesSubplotのどれかを取得し(以下の例ではgraphs[0,0]で左上のグラフを取得)、そこからfigureプロパティを介してfigを取得しています。
graphs = df[df["species"]==selected].hist()
st.pyplot(graphs[0,0].figure)
series.histを使った方法
matplotlibのplt.subplot(行, 列)を使えば、あらかじめ図全体を行列の区域に分割することができます。
図オブジェクト, 軸(個々のグラフ) = plt.subplot(行, 列)以下のコードは図全体を2x2の領域に区切っています。axは軸という英単語です。その複数形がaxesです。今回は複数のグラフを扱うので変数名をaxesとしました。subplots_adjustは個々のグラフの間隔などを調整する関数です。hspaceを使って上下の間隔を調整しました。
fig, axes = plt.subplots(2,2)
plt.subplots_adjust(hspace=0.5)
DataFrameのグラフ描画メソッドにはax引数が用意されており、どこの領域にグラフを描画するか指定できるようになっています。
select_df = df[df["species"]==selected]
select_df["sepal_length"].hist(ax=axes[0,0])
個々の領域はaxes[行,列]のように取り出せます。AxesSubplotsオブジェクトです。このオブジェクトには個々のグラフの見た目を調整するさまざまなメソッドが用意されています。今回はset_titleメソッドでタイトルを設定しました。
axes[0,0].set_title("sepal_length")最後に図全体を描画するため、pyplot関数でfig全体を描画しています。
st.pyplot(fig)Penguins
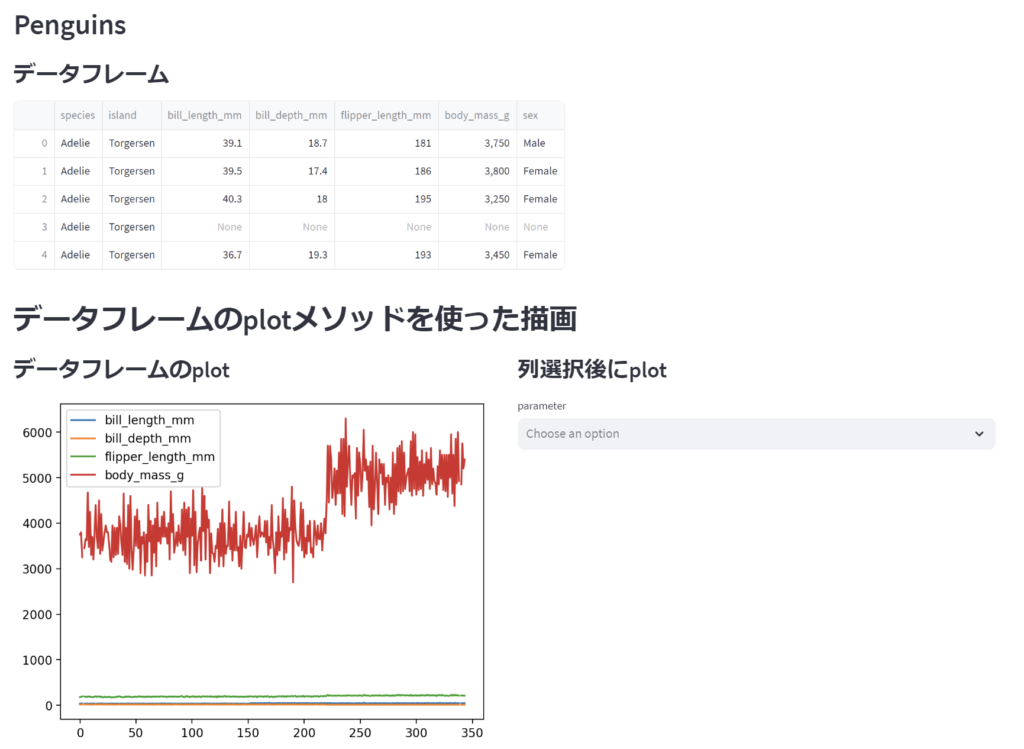
seabornのデータセットPenguinsを使ったサンプルです。
import streamlit as st
import seaborn as sns
import matplotlib.pyplot as plt

st.set_page_config(layout="wide")

df = sns.load_dataset("penguins")

st.header("Penguins")
st.subheader("データフレーム")
st.write(df.head(5))

st.header("データフレームのplotメソッドを使った描画")

col1, col2 = st.columns(2, gap="medium")
with col1:
    st.subheader("df.plot")
    st.pyplot(df.plot().figure)

with col2:
    st.subheader("df[列リスト].plot")
    params = st.multiselect("parameter",
        ["bill_length_mm","bill_depth_mm","flipper_length_mm","body_mass_g"])
    if len(params) > 0:
        st.pyplot(df[params].plot().figure)

st.header("Seaborn")

col1, col2, col3 = st.columns(3, gap="medium")
with col1:
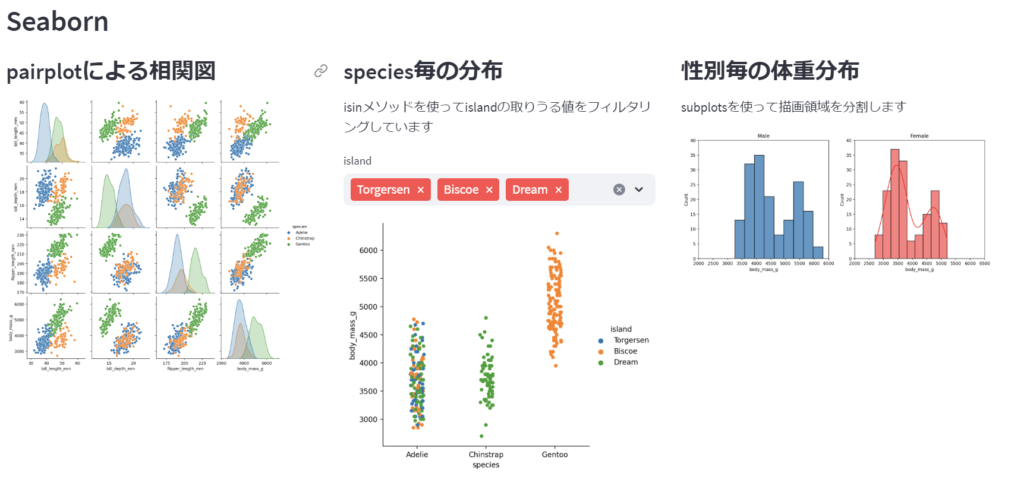
    st.subheader("pairplotによる相関図")
    fig = sns.pairplot(df, hue="species")
    st.pyplot(fig)

with col2:
    st.subheader("species毎の分布")
    st.write("isinメソッドを使ってislandの取りうる値をフィルタリングしています")
    islands = st.multiselect("island", df["island"].unique(), default=df["island"].unique())
    if islands:
        fig = sns.catplot(data=df[df["island"].isin(islands)],
                          x='species', hue="island", y='body_mass_g')
        st.pyplot(fig)

with col3:
    st.subheader("性別毎の体重分布")
    st.write("subplotsを使って描画領域を分割します")
    fig, axes = plt.subplots(1,2, figsize=(12,5))
    sns.histplot(df[df["sex"]=="Male"]["body_mass_g"], ax=axes[0])
    sns.histplot(df[df["sex"]=="Female"]["body_mass_g"],
                 ax=axes[1], color="r", kde=True)
    axes[0].set(xlim=(2000,6500), ylim=(0,40), title="Male")
    axes[1].set_xlim(2000,6500)
    axes[1].set_ylim(0,40)
    axes[1].set_title("Female")
    print(dir(axes[1]))
    st.pyplot(fig)
解説
ページレイアウト
ページ幅の設定はset_page_config関数で行います。今回はlayout=”wide”で画面幅一杯を指定しています。
データフレームの読込みと描画は以下のコードです。先頭の5行分を描画しています。
df = sns.load_dataset("penguins")
st.write(df.head(5))
カラム設定
最初にDataFrameオブジェクトのplot関数を使ってグラフを描画します。今回はst.columns(2, gap="medium")を使用して2列のレイアウトにして2つのグラフを描画しています。
カラムに描画するときは以下のようにwith構文を使うと便利です。
col1, col2 = st.columns(2, gap="medium")
with col1:
    左列の描画
with col2:
    右列の描画
df.plot
左側は最もシンプルな例です。以下のように記述することで、デフォルトのグラフが描画されます。
st.pyplot(df.plot().figure)右側はdfから列を選択し、その結果を描画しています。列の選択にはmultiselect関数を使用しています。
params = st.multiselect("parameter",
    ["bill_length_mm","bill_depth_mm","flipper_length_mm","body_mass_g"])
if len(params) > 0:
    st.pyplot(df[params].plot().figure)
seabornを使ったグラフ
dataframeでのplotは簡単ですが、細かな設定をする場合はseabornの方が適しています。以下のような描画方法があります。
1. 描画関数の戻り値figをpyplot関数に渡す
fig = sns.pairplot(df, hue="species") st.pyplot(fig)pairplot, histplot, lineplotなどさまざまなグラフが描画できますが、単に1つの図を描画するときはこの方法が簡単でしょう。
2. plt.subplotsの戻り値figをpyplot関数に渡す
        import matplotlib.pyplot as plt
        fig, axes = plt.subplots(1,2, figsize=(12,5))
        sns.histplot(df, ax=axes[0])
        sns.histplot(df, ax=axes[1])
        st.pyplot(fig)
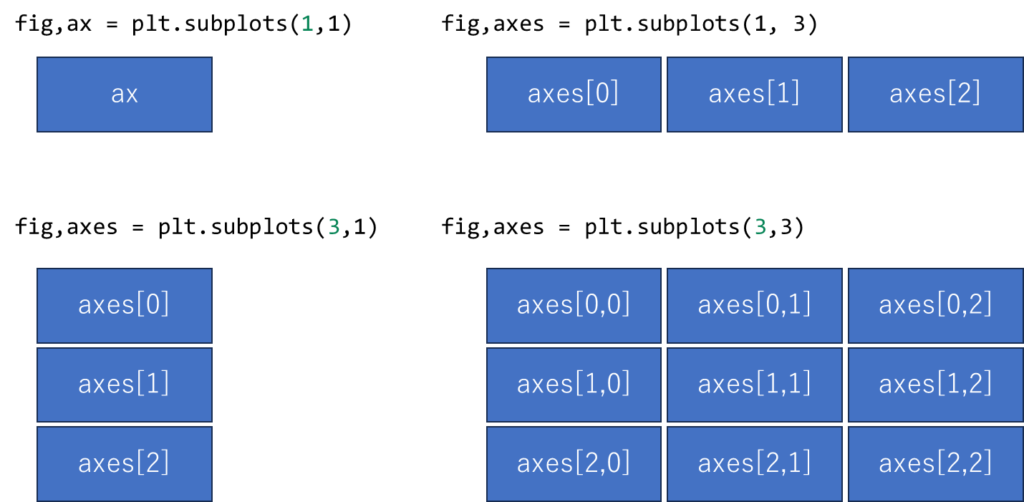
matplotlib.pyplotのsubplots関数を使うことで、描画領域を分割することが可能です。最初の戻り値が図全体のfig, 各グラフの領域がaxesに格納されます。描画場所をax引数で指定して、最後にst.pyplot(fig)でグラフ全体を描画します。 subplots(行, 列)のように描画します。対象とする場所は以下のように記述します。指定した行列の数によって、単なる変数、1次元のリスト、2次元のリストと戻り値のax(es)が変化することに注意してください。
タイタニック
タイタニック号のデータを可視化してみましょう。
import streamlit as st
import seaborn as sns
import matplotlib.pyplot as plt
import japanize_matplotlib

st.set_page_config(layout="wide")

df = sns.load_dataset("titanic")
st.subheader("データフレーム")
st.dataframe(df, height=150)

df["生存・死亡"]=df["survived"].map(lambda x:"生存" if x else "死亡")
df["性別"]=df["sex"].map(lambda x:"男性" if x=="male" else "女性")
classmap = {"First":"1等","Second":"2等","Third":"3等"}
df["客室"]=df["class"].map(lambda x:classmap[x])

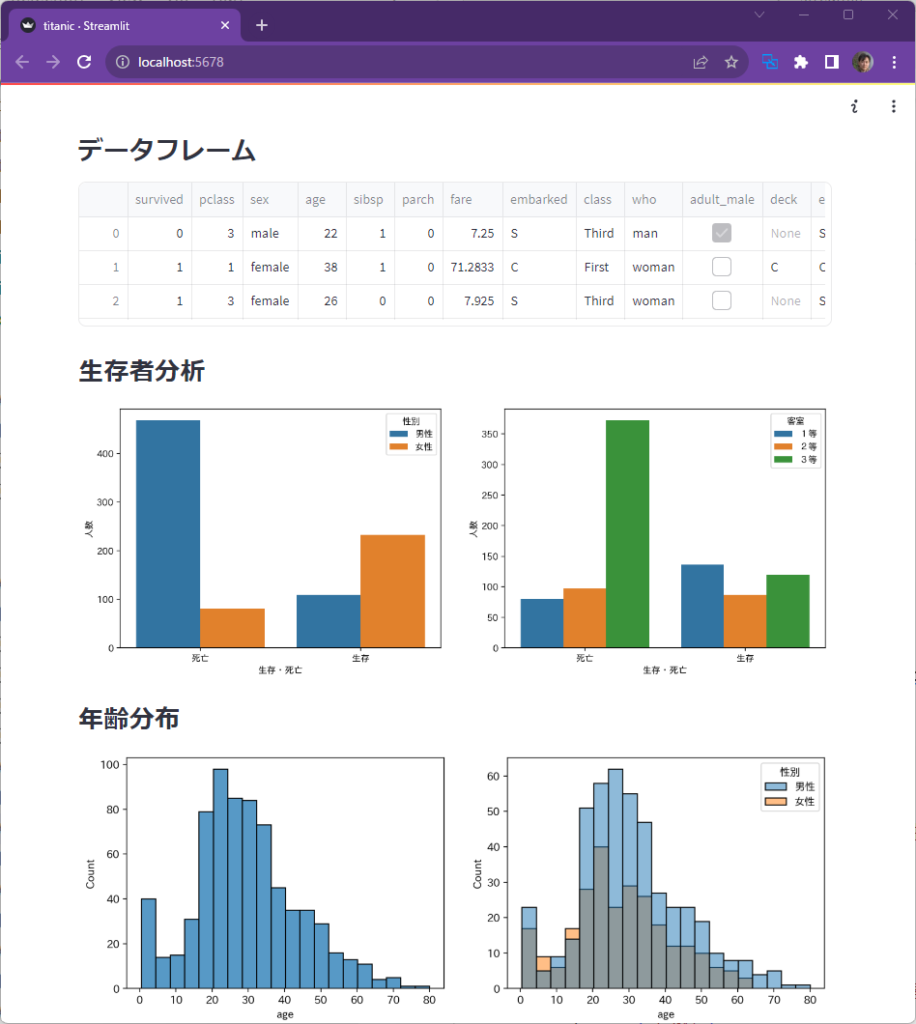
st.subheader("生存者分析")
col1, col2 = st.columns(2)
with col1:
    fig, ax = plt.subplots()
    sns.countplot(df, x="生存・死亡", hue="性別")
    ax.set_ylabel("人数")
    st.pyplot(fig)

with col2:
    fig, ax = plt.subplots()
    sns.countplot(df, x="生存・死亡", hue="客室")
    ax.set_ylabel("人数")
    st.pyplot(fig)

st.subheader("年齢分布")
fig, axes = plt.subplots(1,2, figsize=(12,4))
sns.histplot(df, x="age", ax=axes[0])
sns.histplot(df, x="age", ax=axes[1], hue="性別")
st.pyplot(fig)
解説
データフレームを読み込んだ後に、列の値を日本語に変換するために、mapメソッドを使用しています。列の値を変換するには以下のように、まずデータフレームから列を取り出します。その戻り値はSeries型です。それに対してmapメソッドを呼びます。mapメソッドの引数は関数です。ここではlambdaを使って関数を記述しています。キーワードlambdaの直後に引数を書き、戻り値を:の後ろに記述します。
df[列].map(lambda a:戻り値)今回は以下のような処理を行っています。
- survived列の値1なら”生存”, それ以外を”死亡”とし、”生存・死亡”という列を追加
- sex列の値が”male”なら”男性”、そうでなければ”女性”とし、”性別”という列を追加
- class列の値”First”,”Second”,”Third”という値を辞書を使って、”1等”,”2等”,”3等”に変換し、”客室”という列を追加
生存者分布は、st.columnsを使って、Streamlitで2列に分割し、それぞれに別のグラフを描画しています。
個数に応じた棒グラフを描画するのはcountplot関数が便利です。以下のように値を指定します。
sns.countplot(データフレーム, x=数える列名, hue=内訳)年齢分布は、subplotsを使って1行2列の領域を作成し、それぞれにhistplotでヒストグラムを描画しています。
国別統計
Seabornのサンプルデータから国別の年間消費額と平均寿命のグラフを描画してみましょう。
グラフで日本語文字を描画するにはjapanize-matplotlibモジュールが必要です。以下のコマンドでインストールしてください。
pip install japanize-matplotlibimport streamlit as st
import seaborn as sns
import matplotlib.pyplot as plt
import japanize_matplotlib
st.set_page_config(layout="wide")
df = sns.load_dataset("healthexp")
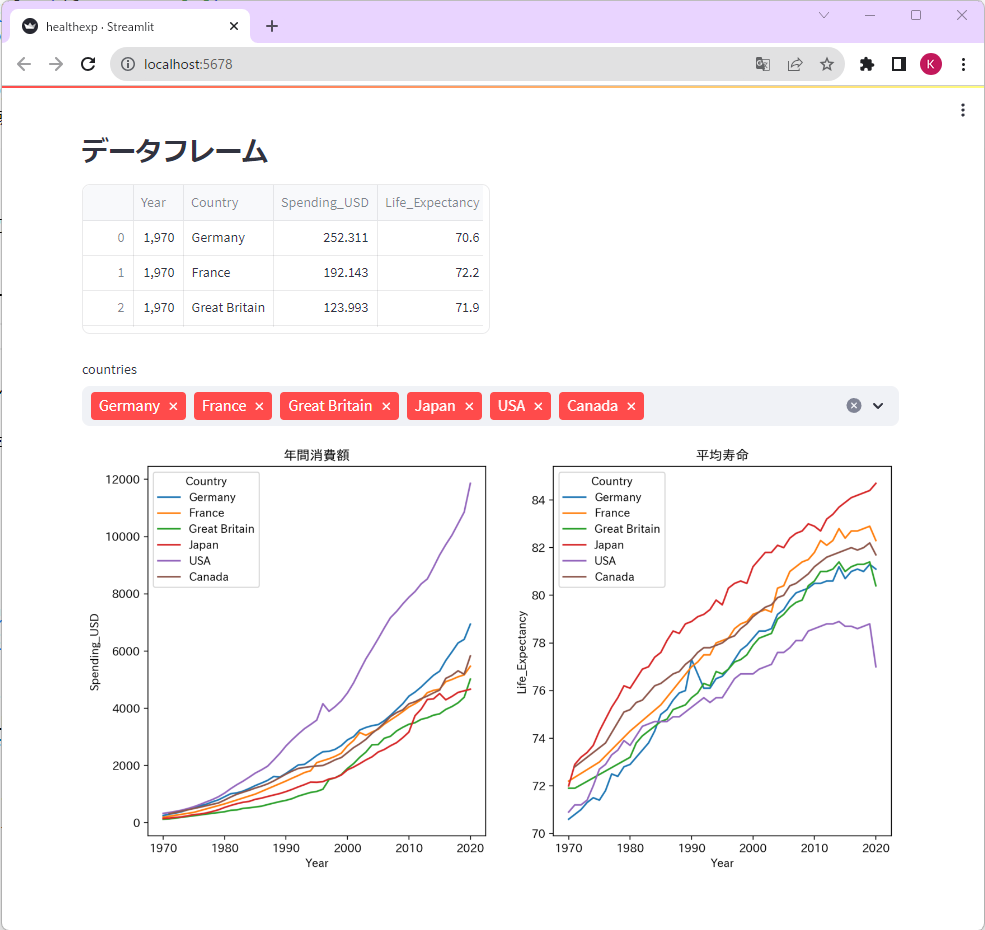
st.subheader("データフレーム")
st.dataframe(df, height=150)
countries = df["Country"].unique()
values = st.multiselect("countries", countries, default=countries)
fig, axes = plt.subplots(1, 2, figsize=(12, 6))
axes[0].set_title("年間消費額")
axes[1].set_title("平均寿命")
sns.lineplot(df[df["Country"].isin(values)],
x="Year", y="Spending_USD", hue="Country", ax=axes[0])
sns.lineplot(df[df["Country"].isin(values)],
x="Year", y="Life_Expectancy", hue="Country", ax=axes[1])
st.pyplot(fig)解説
DataFrameをst.dataframeで描画しています。st.writeでも描画することは可能ですが、st.dataframeにするとheightなどの引数を指定できるようになります。
Country列の取りうる値を変数countriesに代入しています。df[列名]で列のSeriesを取り出し、それに対してunique()メソッドを呼び出しています。
国の選択はst.multiselectで行っています。default引数を指定しておくと、最初から選択状態にある項目を設定できます。
グラフは1行2列の形式になるよう、subplots(1,2)としています。subplotsの戻り値は、最初のfigが図全体を表し, 次のaxesがそれぞれのグラフの軸を表すオブジェクトとなります。今回1行2列というレイアウトなのでaxesは1次元のリストとなります。axes[0]が左のグラフ、axes[1]が右のグラフです。それぞれに、set_titleでタイトルを設定しています。日本語を設定していますが、これを正しく描画するためには、import japanize_matplotlibが必要になることに注意してください。
データフレームではdf[条件]と記述することで、条件に合致する行を抽出することができます。条件にはisinメソッドを使って、選択された国の中に含まれているか否かを指定しています。
df[df["Country"].isin(values)]WordCloud
WordCloudとは文章の中の単語を可視化して表示する機能です。これをStreamlitアプリにしてみましょう。

wordcloudモジュールをインストールします。
pip install wordcloudimport streamlit as st
import matplotlib.pyplot as plt
from wordcloud import WordCloud
text = st.text_area("何でも記入してください",
"""A faster way to build and share data apps.
Streamlit lets you turn data scripts into shareable web apps in minutes, not weeks.
It’s all Python, open-source, and free!
And once you’ve created an app you can use our Community Cloud platform to deploy,
manage, and share your app.
""",height=150)
wcloud = WordCloud().generate(text)
fig = plt.figure(figsize=(20,10))
plt.imshow(wcloud, interpolation="bilinear")
plt.axis("off")
st.pyplot(fig)デフォルトでは英単語にしか対応していません。日本語のWordCloudを表示するには
- 単語に分割するための形態素解析
- 日本語フォントへの対応
などが必要になります。
解説
面倒な処理は全てwordcloudモジュールが実装してくれています。よって、WordCloud()でオブジェクトを作成し、そのgenerateメソッドにテキストを渡すだけです。戻り値で画像が返ってくるので、plt.imshowで画像を描画します。
画像プレビューア
画像をアップロードして、多少加工して描画するアプリです。
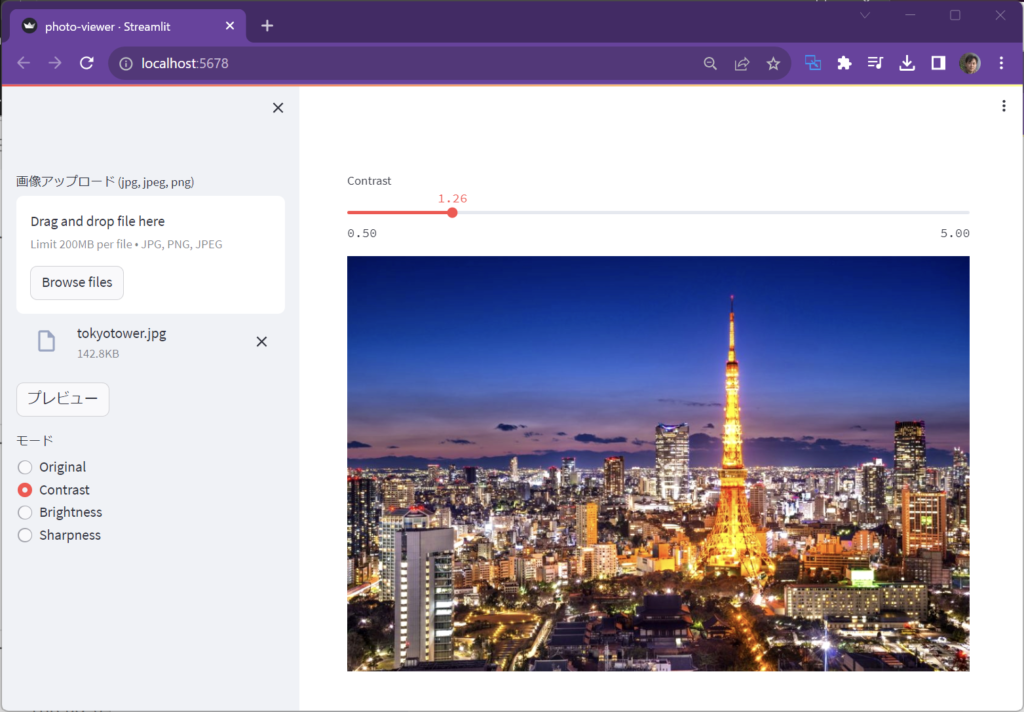
サイドバーからファイルをアップロードします。加工する種類をラジオボタンで選択し、スライダバーで値を調整します。
画像を処理するためにOpenCVモジュールを使用します。また画像を加工するためのPillow(PIL)もインストールしてください。
pip install opencv-python
pip install Pillow
import streamlit as st
import cv2
from PIL import Image, ImageEnhance
image_file = st.sidebar.file_uploader("画像アップロード (jpg, jpeg, png)",
                                      type=['jpg', 'png', 'jpeg'])
if image_file:
image = Image.open(image_file)
if st.sidebar.button("プレビュー"):
st.sidebar.image(image)
modes = ["Original", "Contrast", "Brightness", "Sharpness"]
option = st.sidebar.radio("モード", modes)
if option == "Original":
st.subheader("Original")
st.image(image, use_column_width=True)
elif option == "Contrast":
v = st.slider("Contrast", 0.5, 5.0)
enhancer = ImageEnhance.Contrast(image)
img_output = enhancer.enhance(v)
st.image(img_output, use_column_width=True)
elif option == "Brightness":
v = st.slider("Brightness",0.5,5.0)
enhancer = ImageEnhance.Brightness(image)
img_output = enhancer.enhance(v)
st.image(img_output,width=600,use_column_width=True)
elif option == "Sharpness":
v = st.slider("Sharpness",0.5,5.0)
enhancer = ImageEnhance.Sharpness(image)
img_output = enhancer.enhance(v)
st.image(img_output,width=600,use_column_width=True)解説
以下のコードでfile_uploaderを使用してファイルをアップロードします。そのファイルはimage_file変数に格納されています。
image_file = st.sidebar.file_uploader("画像アップロード (jpg, jpeg, png)",
type=['jpg', 'png', 'jpeg'])画像ファイルがアップロードされたら、Image.open(ファイル)で画像オブジェクトを作成します。
あとは、選択肢に応じて以下のように加工を行います。
enhancer = ImageEnhance.効果(image)
出力画像 = enhancer.enhance(パラメタ値)
人物検出
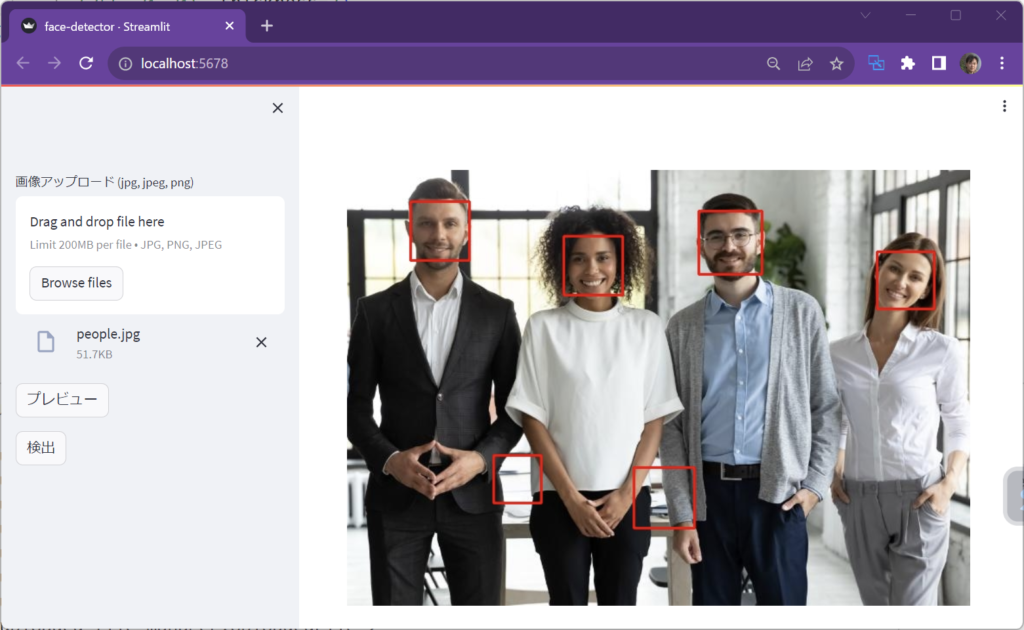
OpenCVを使用すると画像の中から特徴のある領域を検出することができます。そんなアプリを作ってみましょう。
import streamlit as st
import numpy as np
import cv2
from PIL import Image

cascade = cv2.CascadeClassifier('sample-apps/haarcascade_frontalface_alt.xml')

image_file = st.sidebar.file_uploader("画像アップロード (jpg, jpeg, png)",
                                      type=['jpg', 'png', 'jpeg'])
print(type(image_file))
if image_file:
    if st.sidebar.button("プレビュー"):
        image = Image.open(image_file)
        st.sidebar.image(image)

    if st.sidebar.button("検出"):
        image_bytes = image_file.getvalue()
        np_array = np.frombuffer(image_bytes, dtype=np.uint8)
        img = cv2.imdecode(np_array, flags=cv2.IMREAD_COLOR)
        rgb_image = cv2.cvtColor(img, cv2.COLOR_BGR2RGB)
        facerect = cascade.detectMultiScale(rgb_image)
        for rect in facerect:
            cv2.rectangle(rgb_image,
                          tuple(rect[0:2]),
                          tuple(rect[0:2] + rect[2:4]),
                          (255, 0, 0), thickness=2)
        st.image(rgb_image, use_column_width=True)
解説
OpenCVではカスケード分類器を使って顔や目など特徴のある領域を検出することができます。
何を検出するかをXMLファイルで外部から与えます。例えば以下のようなXMLファイルが公開されています。
- haarcascade_eye.xml 目 Haar-like
- haarcascade_eye_tree_eyeglasses.xml メガネ Haar-like
- haarcascade_frontalcatface.xml 猫の顔 (正面) Haar-like
- haarcascade_frontalface_alt.xml 顔 (正面) Haar-like
- haarcascade_frontalface_alt2.xml 顔 (正面) Haar-like
- haarcascade_frontalface_alt_tree.xml 顔 (正面) Haar-like
- …
今回は以下のように顔(正面)を検出する設定ファイルを読み込んでいます。
cascade = cv2.CascadeClassifier('sample-apps/haarcascade_frontalface_alt.xml')ファイルのアップロードとプレビューは前のサンプルアプリと同じです。
ただし、file_uploaderの戻り値はstreamlit.runtime.uploaded_file_manager.UploadedFileという型です。このままではOpenCVに渡すことができないので、以下のように
- getvalueでバイト配列にして
- frombuffer関数でNumPyの配列に変換し
- imdecodeで画像の形式にして、
- cv2.cvtColorで色をBGRからRGBの形に変換する
という作業を行っています。
        image_bytes = image_file.getvalue()
        np_array = np.frombuffer(image_bytes, dtype=np.uint8)
        img = cv2.imdecode(np_array, flags=cv2.IMREAD_COLOR)
        rgb_image = cv2.cvtColor(img, cv2.COLOR_BGR2RGB)
実際の検出を行っているのは以下の行です。
facerect = cascade.detectMultiScale(rgb_image)戻り値のfacerectは検出した領域の情報が返されます。今回のサンプル画像では以下のような値が得られました。
[[169 329  55  55]
 [ 73  36  68  68]
 [406  47  73  73]
 [331 343  70  70]
 [250  76  68  68]
 [612  94  66  66]]
リストのリストの形式です。各要素は[x, y, w, h]の形式で、検出した矩形領域を表しています。このリストから順番に矩形をfor文でとりだし、cv2.rectangleで矩形を描画しています。
ダイヤモンドの価格予想
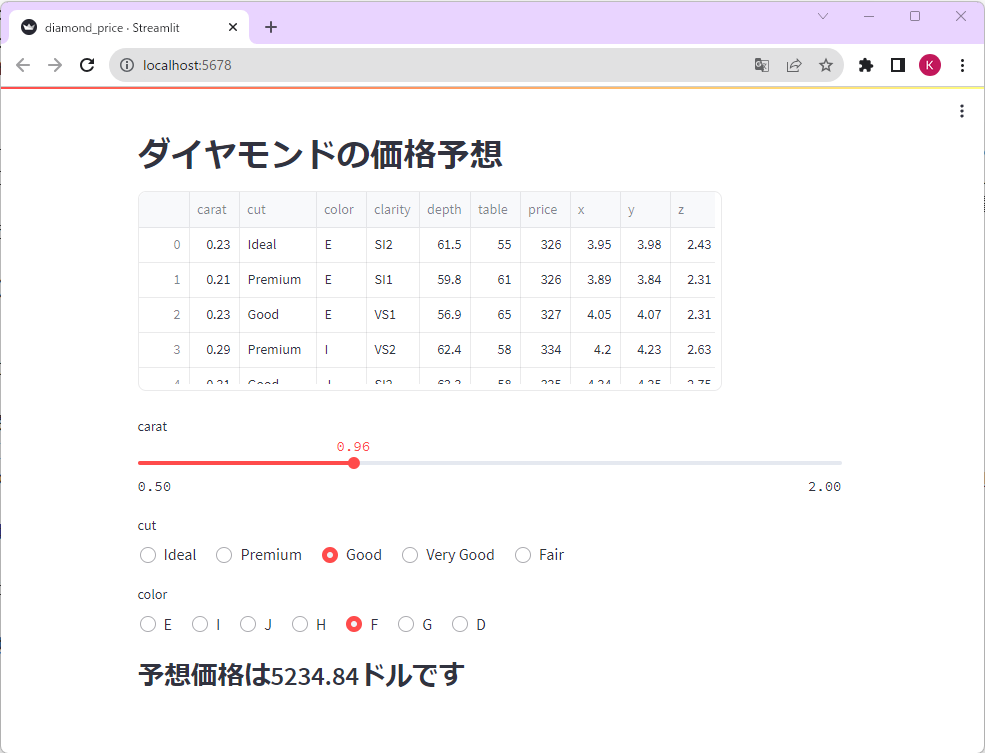
sklearnという機械学習のライブラリを使って、ダイヤモンドの価格予想をしてみましょう。
import streamlit as st
import numpy as np
import pandas as pd
import seaborn as sns
import matplotlib.pyplot as plt
from sklearn import linear_model, preprocessing

df = sns.load_dataset("diamonds")
st.header("ダイヤモンドの価格予想")
st.dataframe(df, height=200)

le = preprocessing.LabelEncoder()
df['cut_no'] = le.fit_transform(df['cut'])
cut_names = le.classes_
df['col_no'] = le.fit_transform(df['color'])
col_names = le.classes_

carat = st.slider("carat", 0.5, 2.0)
cut = st.radio("cut", df["cut"].unique(), index=0, horizontal=True)
color = st.radio("color", df["color"].unique(), index=0, horizontal=True)

clf = linear_model.LinearRegression()
clf.fit(df[["carat", "cut_no", "col_no"]], df["price"])

cut_val = np.where(cut_names == cut)[0]
col_val = np.where(col_names == color)[0]

price = clf.predict(pd.DataFrame([[carat, cut_val, col_val]],
                                 columns=["carat", "cut_no", "col_no"]))
st.subheader(f"予想価格は{price[0]:.2f}ドルです")
解説
sklearnは機械学習用のライブラリです。今回はダイヤモンドのカラット(carat)、カットの種類(cut)、色の種類(color)から値段を予想します。
今回のサンプルでは線形回帰モデルを使用します。この場合、学習用の入力データは数値である必要があります。しかしながら、cutとcolorはカットや色の種類を表す文字列です。このように種類を表す文字列をカテゴリ変数と呼びます。これを数値に変換するためにLabelEncoderを使用しています。
le = preprocessing.LabelEncoder()
df['cut_no'] = le.fit_transform(df['cut'])
cut_names = le.classes_
df['col_no'] = le.fit_transform(df['color'])
col_names = le.classes_
LabelEncoderは以下のように使用します。
変換後の数値列 = le.fit_transform(元データ:文字列のリスト)変換するときの文字列と数値の対応はle.classes_に保存されるので、それを変数に保存しています。
以下が画面上のUI(スライダーとラジオボタン)を作成しているコードです。
carat = st.slider("carat", 0.5, 2.0)
cut = st.radio("cut", df["cut"].unique(), index=0, horizontal=True)
color = st.radio("color", df["color"].unique(), index=0, horizontal=True)
以下は機械学習(モデルを作って、入力データで学習する部分)の部分です。
clf = linear_model.LinearRegression()
clf.fit(df[["carat", "cut_no", "col_no"]], df["price"])
clfがモデルです。入力が2つです。
- df[[“carat”, “cut_no”, “col_no”]] = 説明変数、目的値を求めるために入力する値、3列のデータフレームの形式で与えています。
- df[“price”] = 目的変数、求めたい値、price列(Series型)として与えています。
モデルができたら、入力データを与えると、予想結果(今回は価格)を得ることができます。この予想をするのがpredictメソッドです。入力データは1行3列からなるデータフレームを作成して渡しています。戻り値が予想価格のSeriesとなります。
今回は1つのデータしか予測していませんが、同時に複数の値を入力して、複数の予測値を得られるように、入力がデータフレーム、出力がSeriesとなっています。
最後に戻り値priceの値を画面に出力しています。
演習
どんなアプリでもかまいません。自分なりのオリジナルアプリを作成してみてください。
